
Designing an application is really a set of educated guesses about what features users will actually use. We do interviews, conduct user testing sessions, and use our existing understanding of the “ideal user”, but without data coming in from real users, we just don’t know. In this two part series we will show you how to get this sort of data.
Telemetry: The Raw Numbers
The idea here is simple: track user actions in your application and send that information (“telemetry”) to a service that will aggregate it. Most analytics packages do this, but they are oriented towards so called ‘normal’ web pages, and the information they provide for javascript heavy pages (aka apps) is very limited without doing some additional work.
Types of Telemetry
We are interested in three classes of telemetry data - Page Views, User Actions, and in-browser performance. In this post we will introduce these classes, give some ideas of what to track, and how to organize things. Next post we will review how to actually implement the tracking.
Page Views
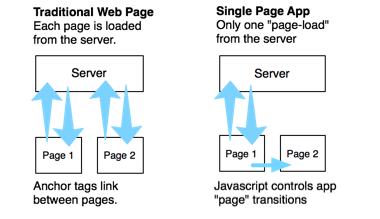
While there are many “page view” tracking techniques, they usually revolve around full-page refreshes. Of course, modern javascript applications eschew the full-page refreshes in favor of a more immersive applications that manipulate the url via html5 push-state.
Put another way, a user may spend 40 minutes using your web app, but traditional “page view” measurement may only register a single “hit” - when the page first loads.
Thus, when building rich javascript application, we need to help out and manually collect this information as the user changes pages, or “context” within your application. While most “single-page applications” don’t have clear boundaries between “pages”, we can usually break things down into reasonable units. Most applications will have some “home” or landing view, a search view, one or more types of search results views, item detail views etc etc.
The main thing is to come up with a naming convention for these “pages” that is consistent and makes logical sense.
We will look at the details of how to integrate this sort of tracking in the next post, but if your application has a “router”, that is likely a good place to attach page view logging.
User Actions
Being able to track User Action is the core to being able to tell which features are actually being used. Since you are instrumenting the code yourself, you can track virtually anything that raises an event.
In our case, we want to measure the percentage of users change the base map, the size of the map, and virtually every other interface interaction.
The really boils down to adding code into every DOM event handler in the app, so how we structure our telemetry helpers will be really important - we don’t want to have brittle code littered all over the app. Think about having a central “telemetry service” that is available to all views or DOM events in the application.
Having a good naming convention is even more important for this type of tracking since these will likely be added by more than one developer and a mish-mash of naming will make the telemetry data a mess to work with. On the upside, it’s pretty easy to tweak
In-Browser Performance
The third type of information we want to track is related to performance. For our team, we develop on Chrome Canary, on maxed out Retina Macbook Pros while using high-speed internet. Unfortunately not all our users will have such an optimized environment. Add the fact that we are supporting IE8/9/10/11, Chrome, Firefox, Safari and Opera, virtually the only way to get realistic performance information for all those platforms is to harvest it from real users.
The end-goal of course is to help improve the real-world performance of the application. But, before we start wildly poking around the code base tweaking things we think may be performance bottle-necks, we want to have the system instrumented so we know where the real bottle necks are, and that when we deploy changes, we really do see improved performance.
So - what do we want to time? Initially, for our project, we want to track basic page load times, network calls (xhr’s), and computationally intensive code blocks (client-side filtering). Some specific timers:
- how long did it take to load the page and initialize the app?
- how long did it take to initialize the map?
- how long did it take to execute a search?
- how long did it take to display a layer?
- how long did it take to sort a table?
- how long did it take to filter a table?
While page view and events are essentially single calls, tracking timing requires two actions - one to start a timer, and a second to stop it and record the duration. Once again, having sensible, consistent naming is really helpful.
In the second part of this post, I will talk about how to integrate telemetry into an application.
Radio Telescope photo modified from Stephen Hanafin’s Flickr stream. cc by-sa.