When writing unit tests, we want to spend our time wisely, and focus our efforts on areas of the application where test coverage provides the most benefit - typically this means business logic, or other complex “orchestration” code. We can gain insight into this by using “code coverage” tools, which report back information about the lines of code that area executed during your tests.
Coverage is typically reported as a percentages - percentage of statements, branches, functions and lines covered. Which is great… except what do these numbers really mean? What numbers should we shoot for, and does 100% statement code coverage mean that your code is unbreakable, or that you spent a lot of time writing “low-value” tests? Let’s take a deeper look.
Here is the output from our automated test system (grunt + jshint + jasmine) on our project. Included is a “coverage summary.
These numbers have been holding steady throughout the development cycle, but what do these numbers mean? Lets break them down a little
Coverage Measures
The first one is “statements”. In terms of code coverage, a “statement” is the executable code between control-flow statements. On it’s own, it’s not a great metric to focus on because it ignores the control-flow statements (if/else, do/while etc etc). For unit tests to be valuable, we want to execute as many code “paths” as possible, and the statements measure ignores this. But, it’s “free” and thrown up in our faces so it’s good to know what it measures.
Branches refer to the afore mentioned code-paths, and is a more useful metric. By instrumenting the code under test, the tools measure how many of the various logic “branches” have been executed during the test run.
Functions is pretty obvious - how many of the functions in the codebase have been executed during the test run.
Line is by far the easiest to understand, but similar to Statements, high line coverage does not equate to “good coverage”.
Summary Metrics
With that out of the way, let’s look at the numbers.
Since statements is not a very good indicator, let’s skip that. We notice it, but it’s not something we strive to push upwards.
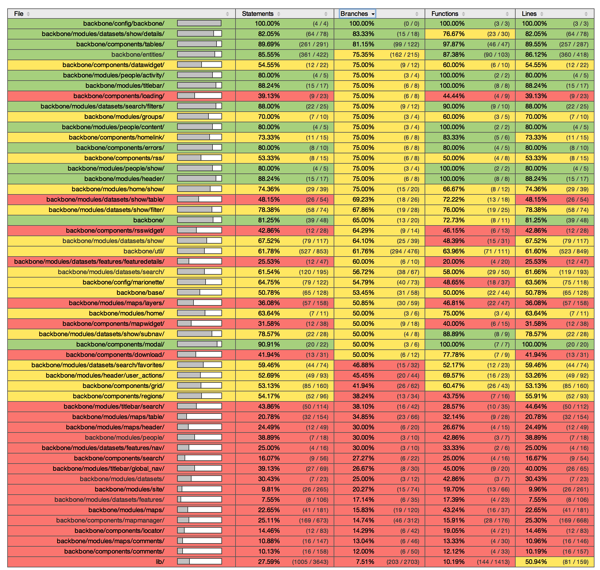
On Branches we are at ~42%, which is lower than I’d like, but we’ll get into this in a moment.
Functions are ~45%, but this is a little skewed because in many controllers and models we add extra functions that abstract calls into the core event bus. We could inline these calls, but that makes it much more complex to create spies and mocks. In contrast, putting them into separate functions greatly simplifies the use of spies and mocks, which makes it much easier to write and maintain the tests. So, although creating these “extra” methods adversely impacts this metric, it’s a trade off we are happy with.
Where does this leave us? These numbers don’t look that great do they? Yet I’m blogging about it… there must be more.
Detailed Metrics
These summary numbers tell very little of the story. They are helpful in that they let us know at a glance if the coverage is heading in the right direction, but as “pragmatic programmers” our goal is to build great software, not maximize a particular set of metics. So, we dig into the detailed reports to check where we have acceptable coverage.

The report is organized around folders in the code tree, and summarizes the metrics at that level. I’ve sorted the report by “Branches”, and while we can see a fair bit of “red” (0-50% coverage) in that table, the important thing is that we know what has low coverage - as long as we are informed about the coverage, and we decide the numbers are acceptable, the coverage report has done it’s job.

Diving down to the file level, we can check if we have high-levels of coverage on the parts of the code that really matter. For us, the details controller and view are pretty critical, so we can see that they have high coverage. It should be noted that high coverage numbers don’t always tell the whole tale. For critical parts of our code base, we have many suites of tests that throw all manner of data at the code. We have data fixtures for simulating 404’s from APIs, mangled responses, as well as many “flavors” of good data. By throwing all this different data at our objects we have ‘driven’ much of the code that handles corner cases.
Here is a look at the Models in our application.

We can easily tell that our models have very good coverage - and this recently helped us a ton when we refactored our back-end API json structure. Since the models contain the logic to fetch and parse the json from the server, upgrading the application to use this new API was relatively simple: create new json fixtures from the new API, run the tests against the new fixtures, watch as most of the tests fail, update the parser code until the tests pass and shazam, the vast majority of the app “just worked”. Without these unit tests, it would have taken much longer to make this change.
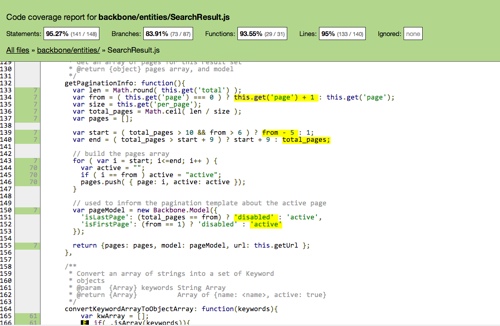
The system we use allows us to dive down even further - to check the actual line-by-line coverage.

Adding Code Coverage Reports
There are a number of different tools that can generate code coverage reports. On our project we are using istanbul, integrated with jasmine using a template mix-in for grunt-contrib-jasmine. Istanbul can also be used with the intern, and karma test runners. If you are using Mocha, check out Blanket.js.
If you are just getting into unit testing your javascript code, this is kinda the deep-end of the pool - so I’d recommend checking out jasmine or mocha, and get the general flow of js unit testing going, look at automating things with a runner like karma or jasmine, and then look at adding coverage reporting.
Hopefully this helps show the benefit of having code coverage as part of your testing infrastructure, and helps you ship great code!